/https%3A%2F%2Fcentrumforidrottsforskning.se%2Fwp-content%2Fuploads%2F2026%2F04%2FBB190726BB625-scaled.jpg)
Successful elite sport policies
– The development of international elite sports
Veerle De Bosscher, Vrije Universiteit Brussel (VUB) & Simon Shibli, Sheffield Hallam University
Introduction
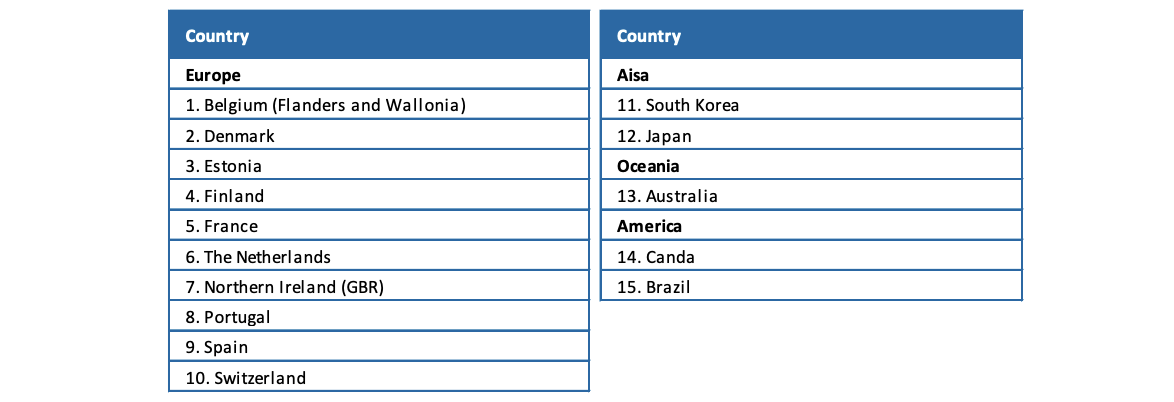
In 2023, the international research network Sports Policy factors Leading to International Sporting Success (SPLISS) celebrated its 20th birthday. This chapter provides an overview of the network’s origin, key characteristics of international elite sport policies and systems, and key findings developed through several SPLISS projects. Sweden unfortunately was unable to participate in these large-scale projects. However, it did take part in a light version in 2020, under the lead of Peter Mattsson from the Swedish Sport Confederation, whereby the SPLISS group compared financial support figures in 15 nations. A second SPLISS light study will be taken up again in 2024.
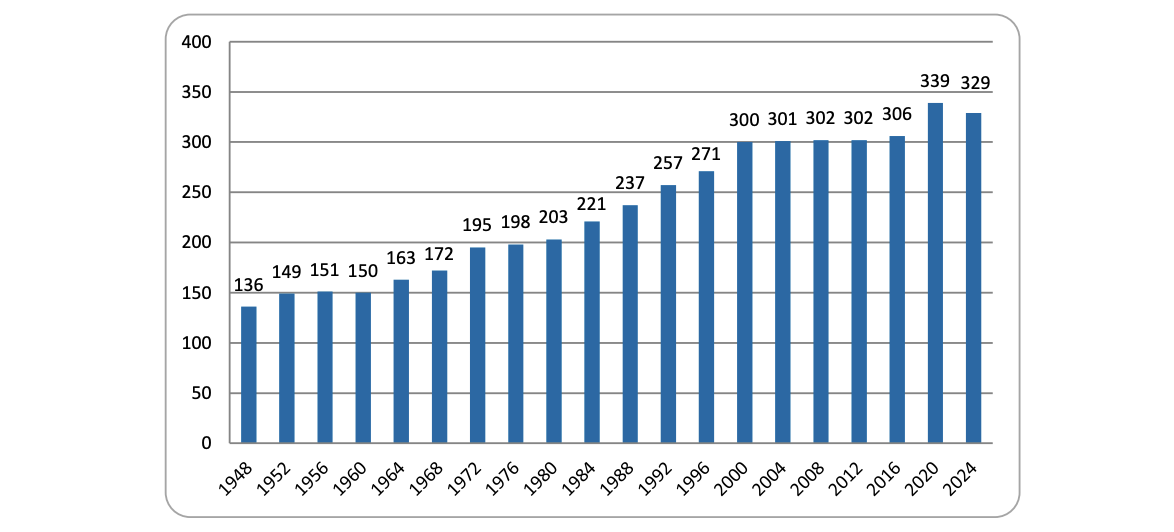
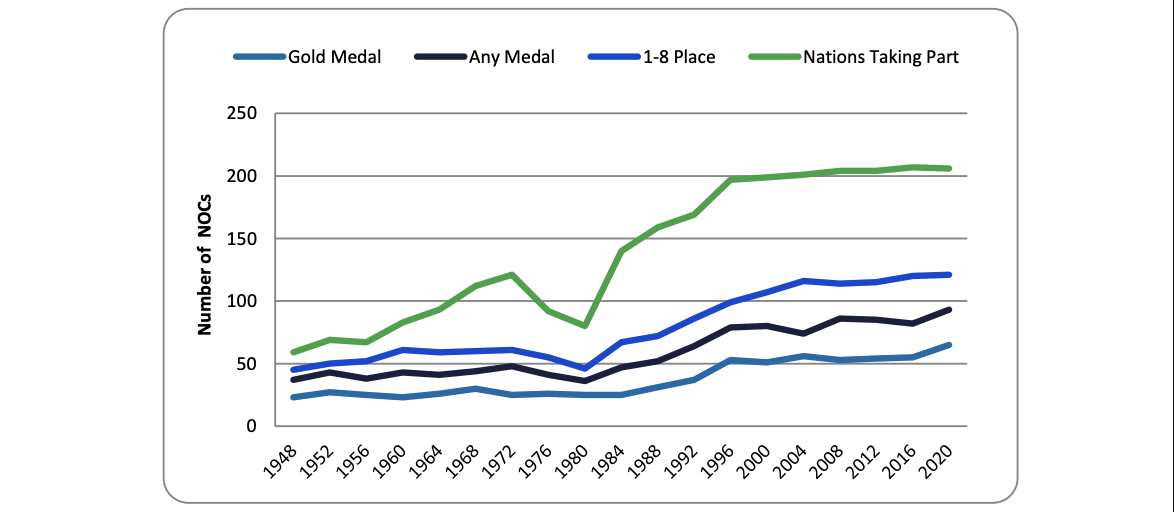
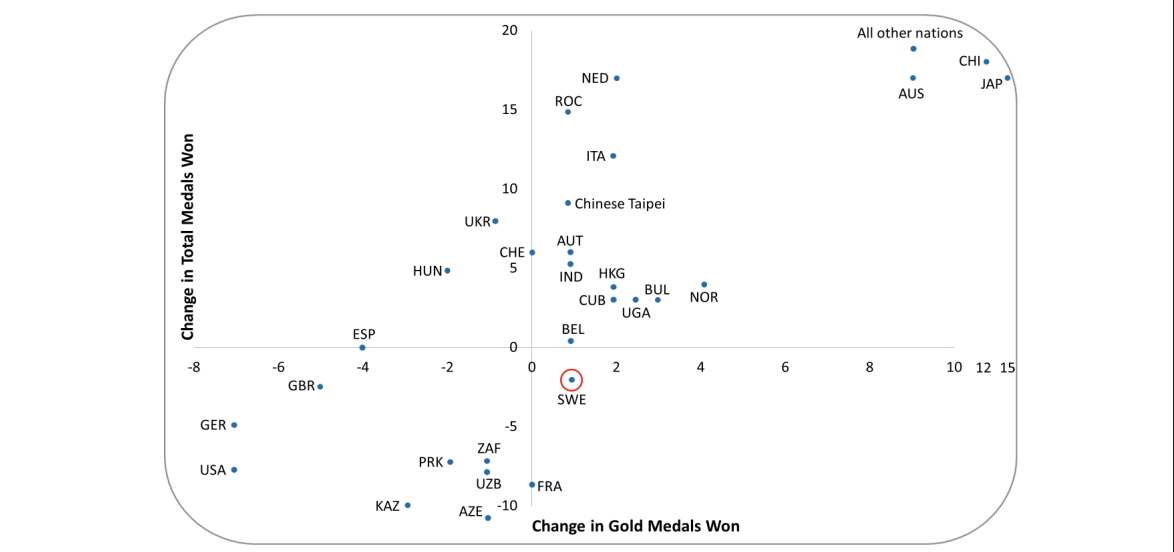
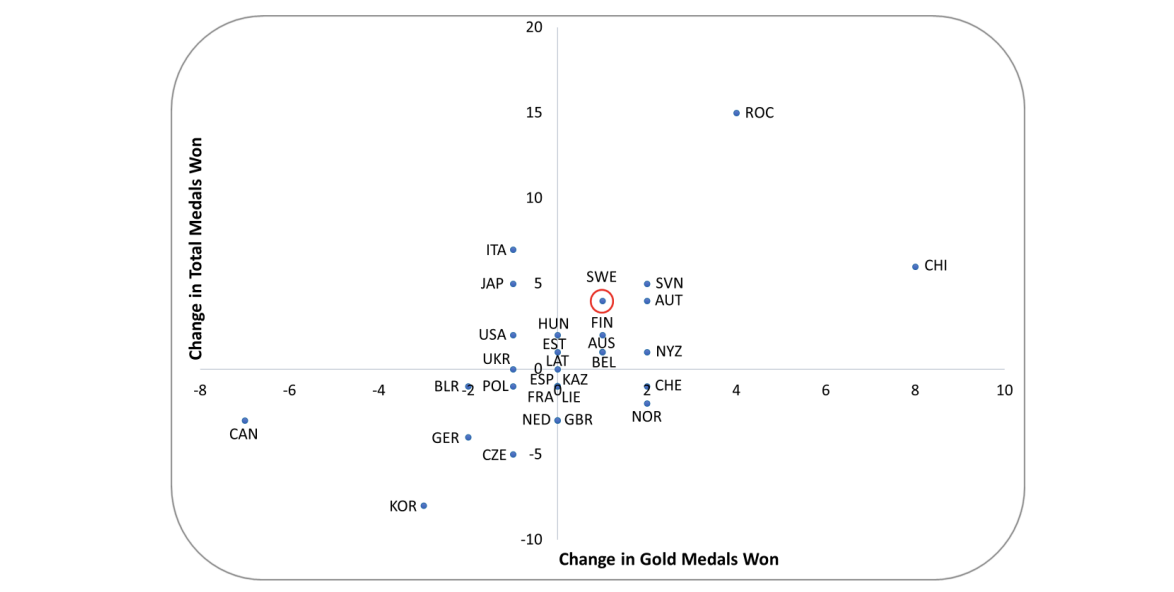
Before starting our analysis, we provide a contextual overview looking at the big picture of all participating nations and the underlying factors that contributed to the Tokyo 2020 Olympic Games. Following this introduction, our chapter is structured as follows:
- the international context of elite sport
- background on SPLISS
- how we work – key characteristics of SPLISS
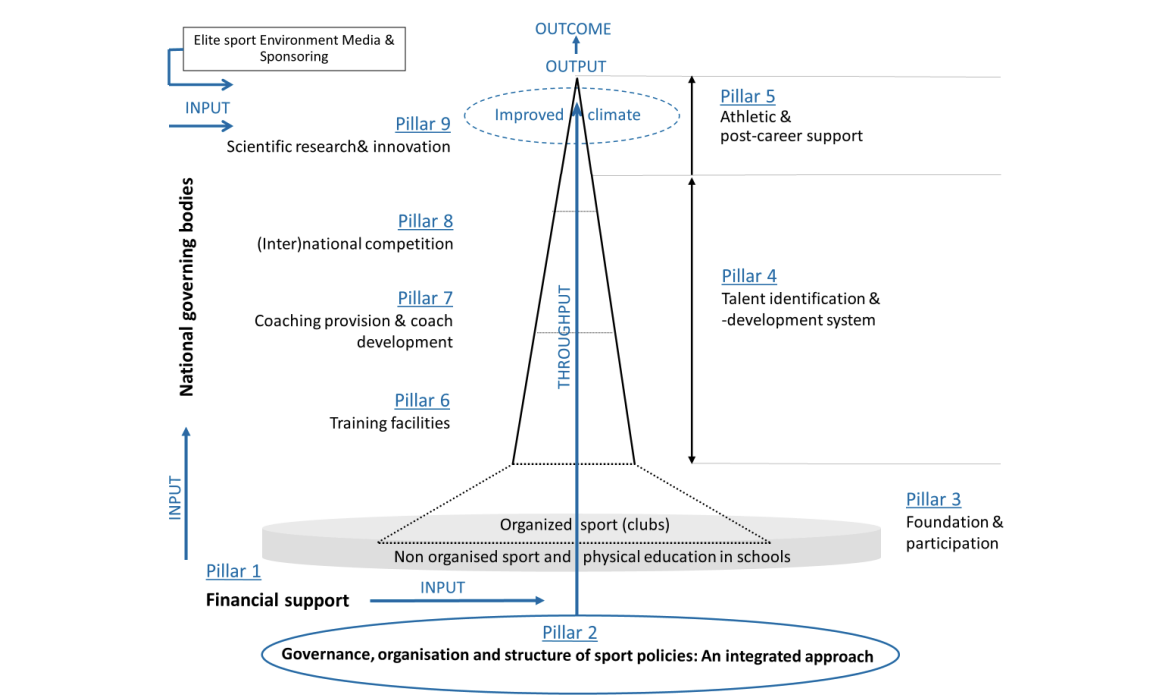
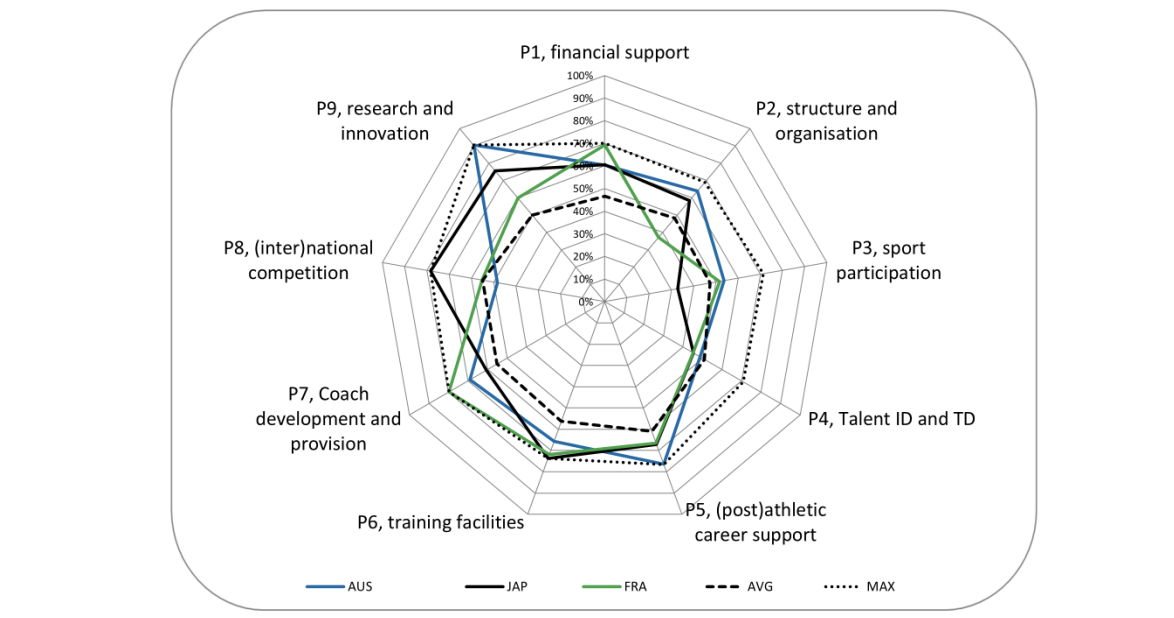
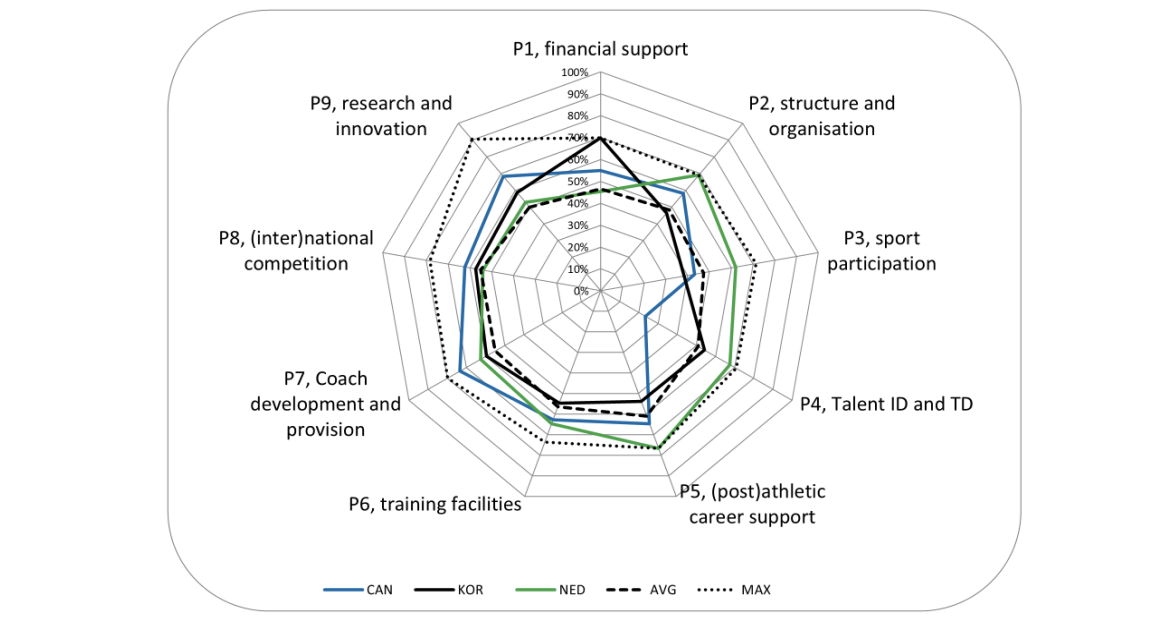
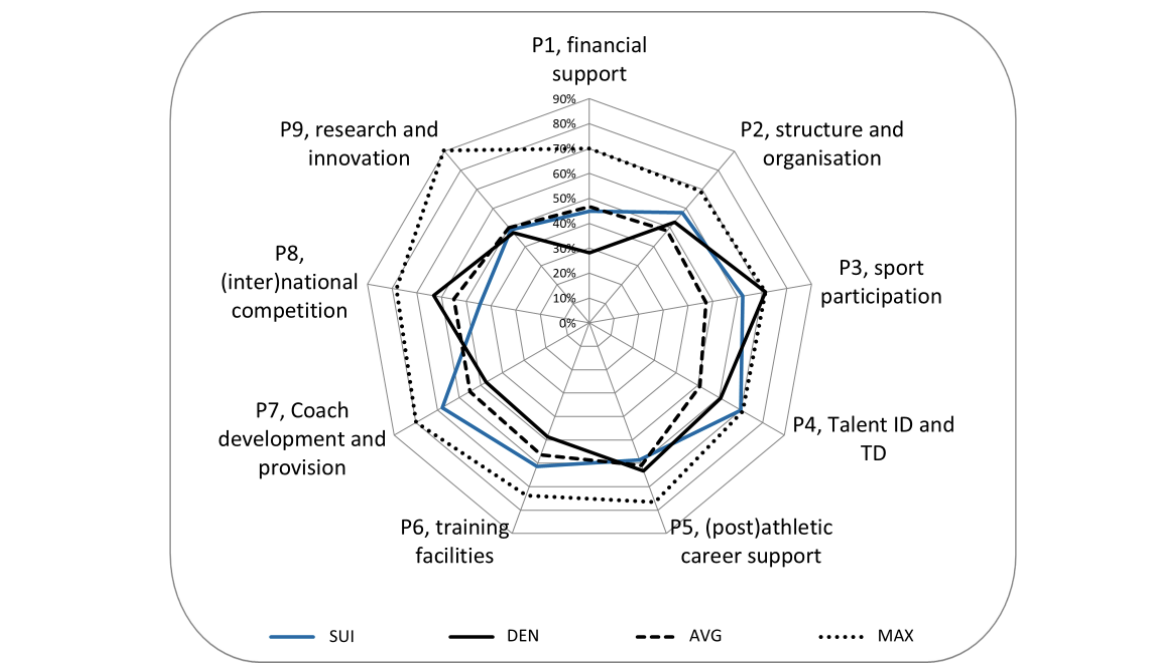
- Pillar performance in 15 nations
- summary SPLISS Key findings
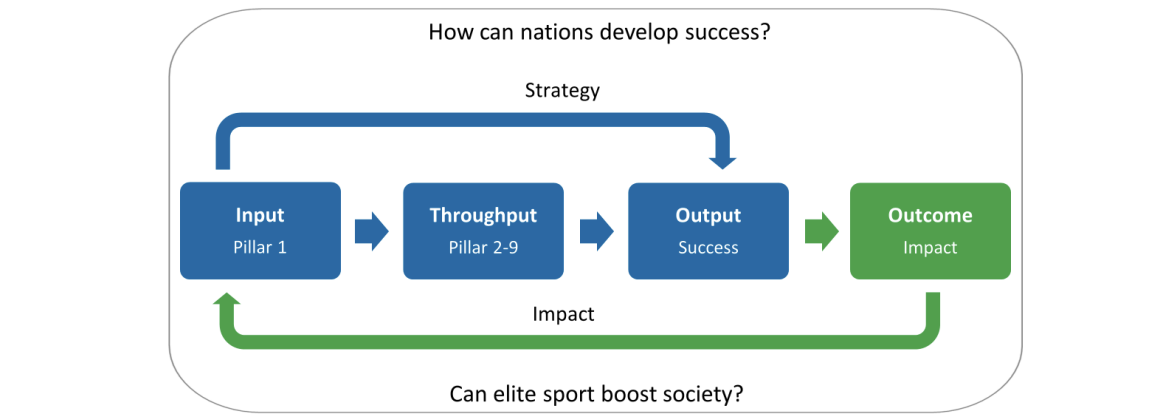
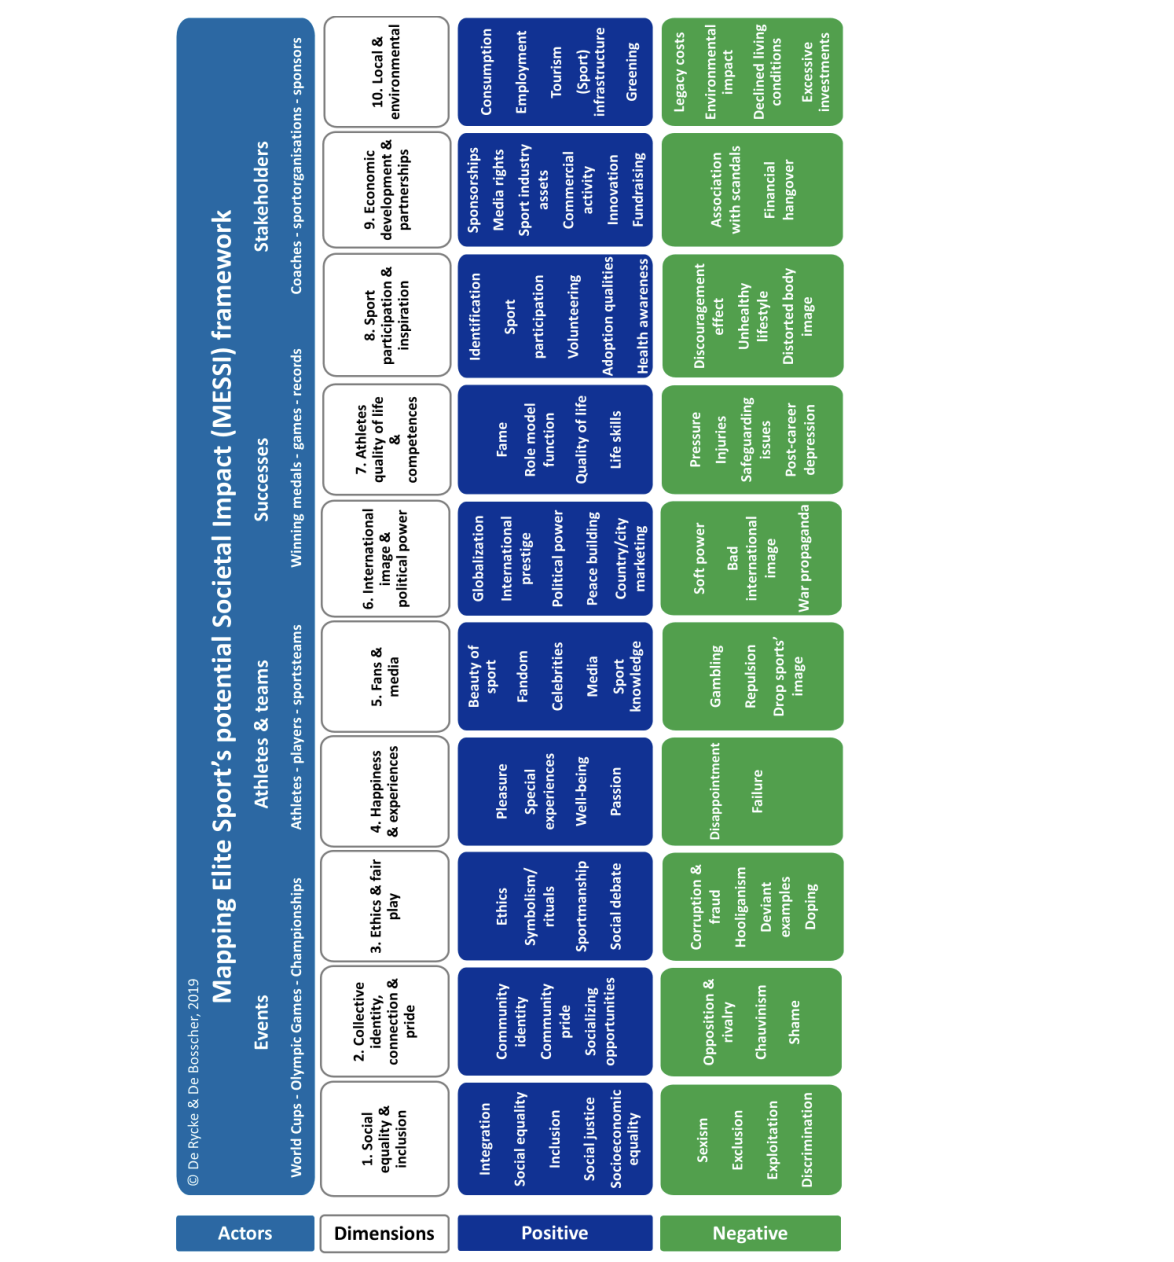
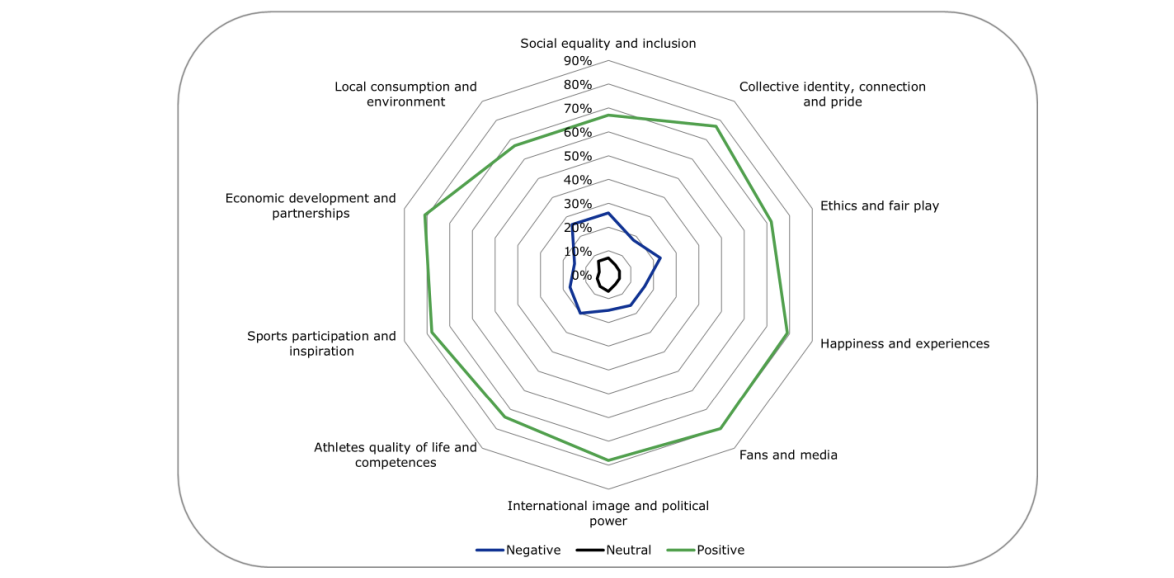
- why do nations invest in elite sport? The MESSI framework
- final note.